

Photo by Babatunde Olajide on Unsplash
Cost of Rent in Lagos, Nigeria.
Analysing real estate data to identify factors that determine the cost of rent of residential properties in Lagos, Nigeria and its effect.


Introduction
A couple of months ago I attended DataCamp's Data Radar, it was an exciting webinar and I enjoyed every session held and all the helpful information being shared particularly the session with Nick Singh when he spoke about doing a data analytics project that is personal to you, something that you are passionate about and that is relevant to you and your experiences and that is what has inspired this project.
House hunting in Lagos is the ghetto! From sketchy house agents that are only concerned with collecting their agency fees to the landlords that build clay houses and use POP and fine gates to deceive potential tenants but what never ceases to amaze me is the cost of renting these houses. In the past 3 years, I have had to move twice and have gone through that mental topsy-turvy way more than any human deserves to (sigh!) so, I decided to do a project, analysing real estate data to determine factors that affect the price and how these factors affect it, just to provide you with a little bit of background information and to prepare you for the plethora of "wahala" that awaits you if and whenever you plan on moving to Lagos state or a different area in Lagos.
Tools Used
R studio
Microsoft PowerBI
Data Source
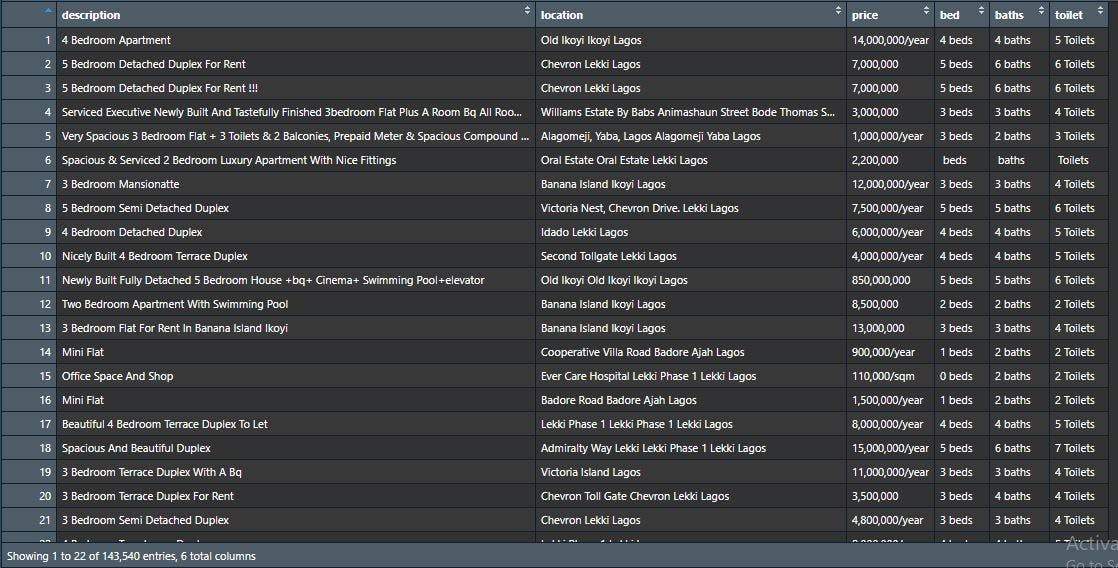
Data was scrapped from propertypro.ng, a real estate website that advertises co-working spaces, commercial properties, flats/apartments, houses and land for sale, rent and short letting in Nigeria. I filtered the available properties for only the ones located in Lagos state and scrapped the data (which includes the property's description, price (in Naira), location, number of bedrooms, baths and toilets) using the R package, rvest.
Scrapped Data:
Data Cleaning and Preparation
I started the data cleaning process by first duplicating my scrapped data, having a duplicate of your original dataset is a data analytics good practice as it serves as a reference point at any time during the cleaning and preparation process. I focused my dataset on properties that were up for yearly rent by filtering out the properties with monthly, daily and per sqm payments and then, I began to clean individual columns, preparing the dataset for analysis. This involved the following steps:
Cleaning the price, bed, baths and toilets column by removing suffixes like "/year", "beds", "baths" and "toilets" and then, converting the column to a numerical data type.
Creating the "city" column from the "location" column. This grouped the entire dataset into 43 different cities located in Lagos, Nigeria.
Filtering out properties not located in Lagos.
Filtering out non-residential properties.
Filtering out properties with prices less than 20,000 and greater than 50,000,000. The website's summary of the houses for rent showed that the minimum price is 20,000 and the max price is 50,000,000.
Creating the "house_type" column from the "description" column. This grouped the entire dataset into 8 categories; flats & apartments, duplexes, maisonettes, mansions, self-contain, bungalows, penthouses and others. Others include properties with vague descriptions or uncommon house types eg "room & parlour", and "townhouse".
Creating the "new" column from the "description" column. This column indicates if the property is newly built or is an old building.
Dropping rows with missing values.
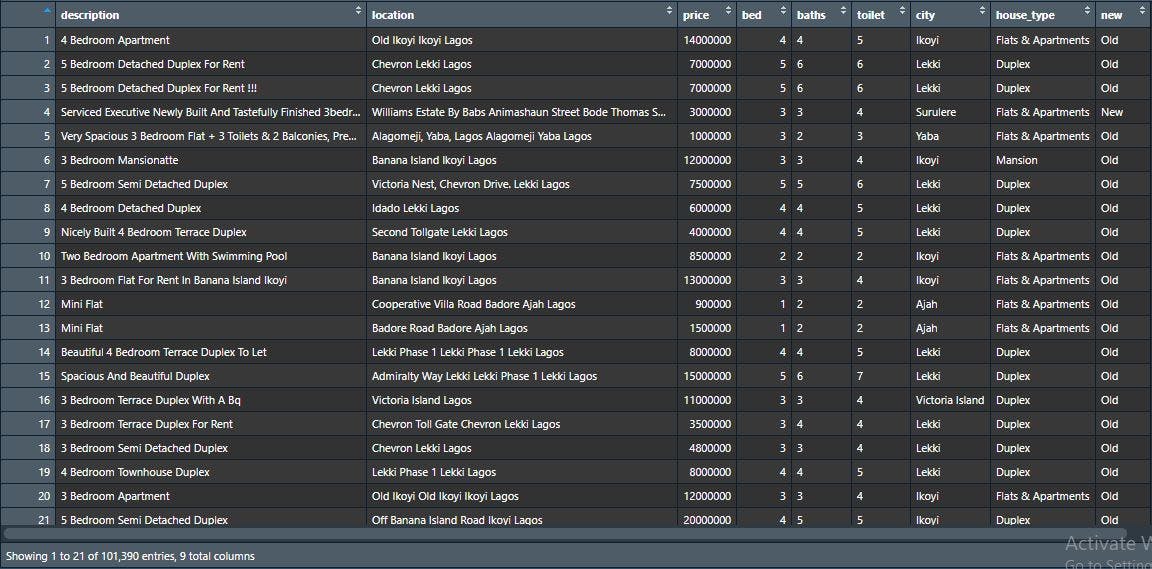
Cleaned and Processed:
Exploratory Data Analysis
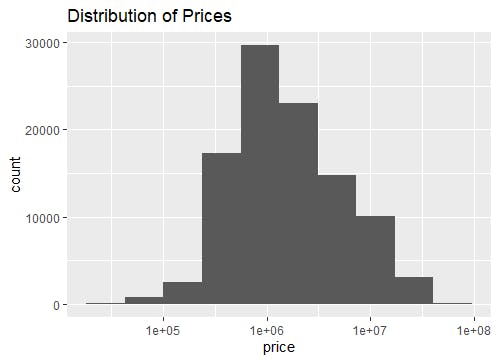
To explore the data, I started by summarising the price column which yielded the following results:
Min: 22,000
1st Quadrant: 650,000
Median: 1,400,000
Mean: 3,426,688
3rd Quadrant: 3,500,000
Max: 48,000,0000
The difference between the median and mean shows a positive skew and a histogram confirms the distribution of the price column is positively skewed.
After this the distribution of the price column was explored based on the categorical variables in the dataset using box plots.
City
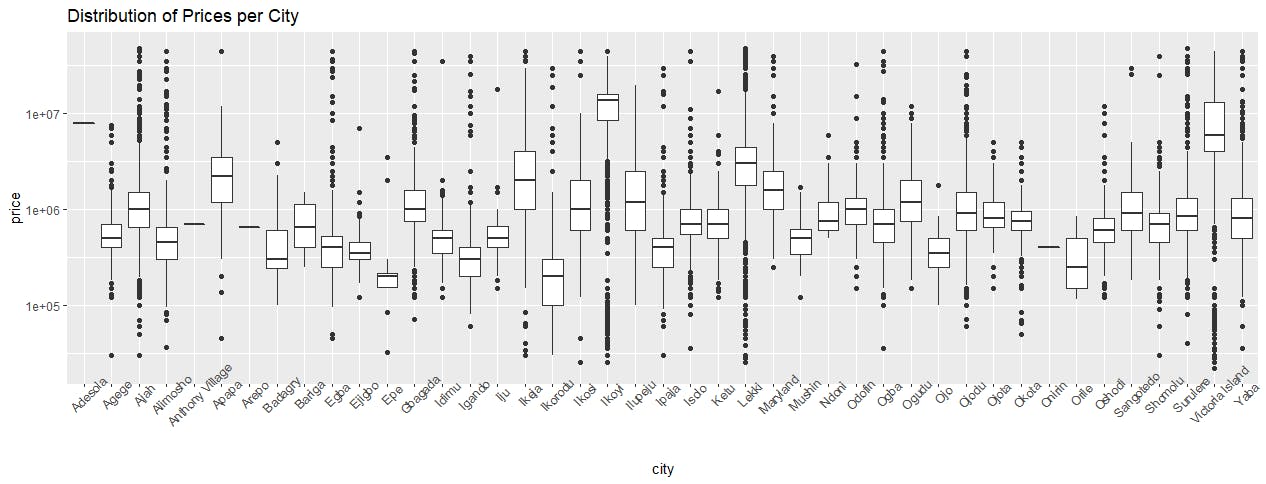
Ikoyi, Lekki and Victoria Island have distinctively higher median prices compared to other cities.
House Type
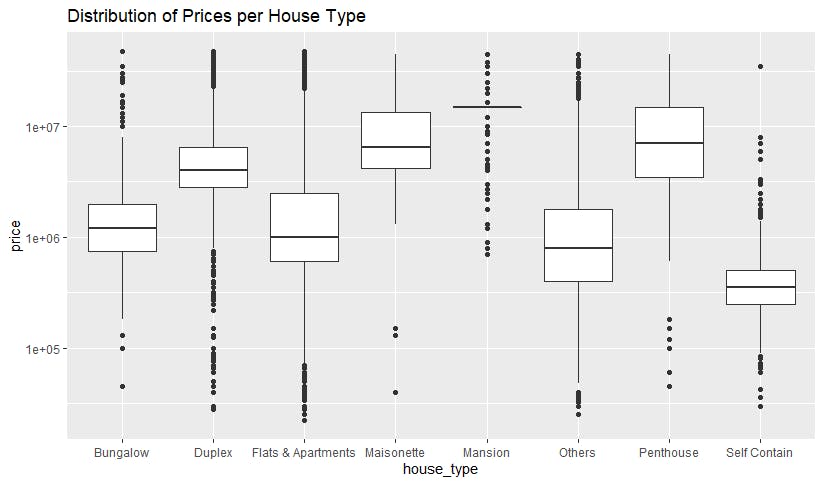
Penthouses, Mansions and Maisonettes have higher median prices with Self Contain having the lowest median price.
Bed
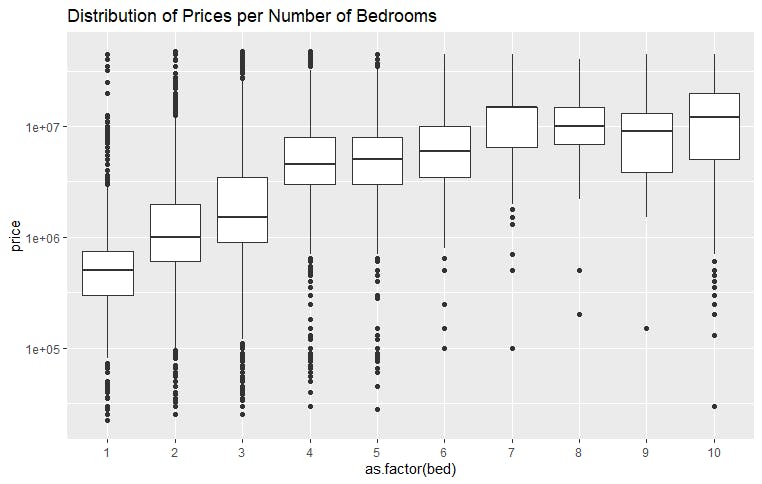
The median price of each bedroom increases with the number of bedrooms, with the exception of the 7-bedroom category.
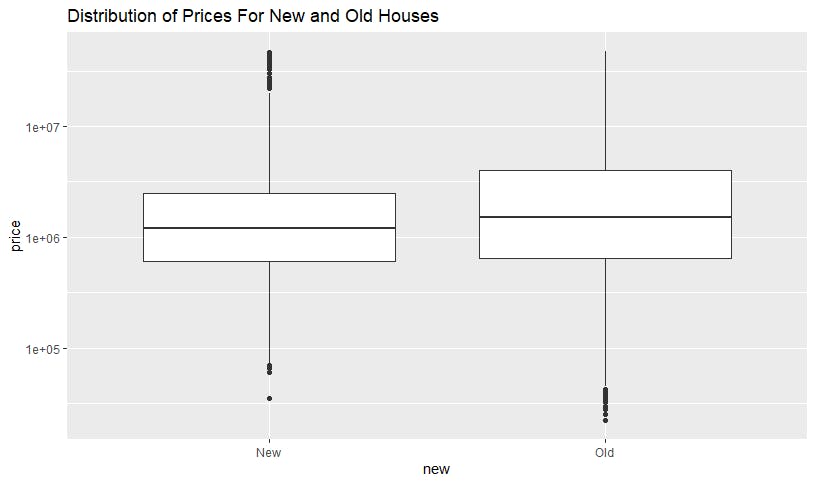
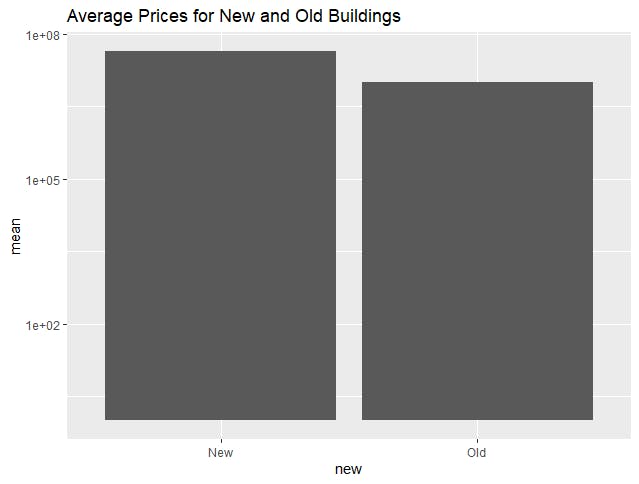
New
Hypothesis Tests
A hypothesis test was then carried out on each categorical variable to see if the cost of renting a house varies significantly across the different factors of that categorical variable (to determine if truly the price is affected by that categorical variable). Due to the skewed nature of the price distribution, a Kruskal-Walis test was carried out with:
The null hypothesis, Ho states that M1 = M2 = M3 = … = Mk (i.e. the mean prices are equal throughout that category and hence the categorical variable does not affect the price).
An alternative hypothesis, Ha states that the mean price of at least 2 factors are different and hence the categorical variable affects the price
A confidence level of 95%
City
Kruskal-Wallis chi-squared = 64379, df = 42, p-value < 2.2e-16
Interpretation: Rejects null hypothesis in favour of the alternative hypothesis.
House Type
Kruskal-Wallis chi-squared = 28479, df = 7, p-value < 2.2e-16
Interpretation: Rejects null hypothesis in favour of the alternative hypothesis
Bed
Kruskal-Wallis chi-squared = 45265, df = 9, p-value < 2.2e-16
Interpretation: Rejects null hypothesis in favour of the alternative hypothesis.
New
Kruskal-Wallis chi-squared = 356.55, df = 1, p-value < 2.2e-16
Interpretation: Rejects null hypothesis in favour of the alternative hypothesis.
The hypothesis tests prove that the prices of houses for rent in Lagos vary depending on the city it is located in, the type of house, the number of bedrooms and if the building is a new (or newly renovated) or an old building.
Analysing the Data
I started by plotting a bar chart of the average price per number of bedrooms.
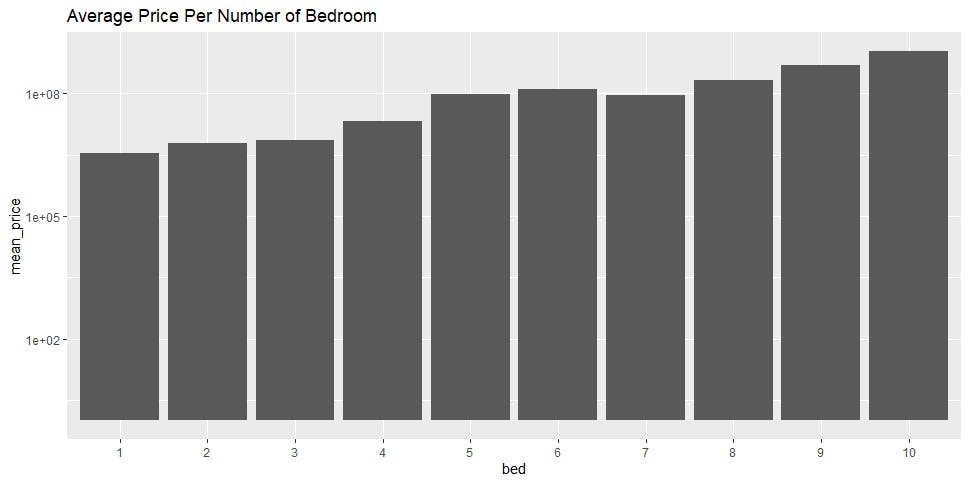
The bar chart shows a trend between the average price and the number of bedrooms in a property, the price increases as the number of rooms increases.
Doing the same thing with the "new" column shows that new buildings have a slightly higher average price compared to older buildings
Investigating the distribution of house types per city showed that the house types are randomly distributed with some cities having only one house type. "Flats & Apartments" had the largest proportion in every city.
Investigating the distribution of cities per house type showed that:
"Ajah" has the highest proportion of Bungalows (20%).
"Lekki" has the highest proportion of Duplexes (47%).
"Lekki" has the highest proportion of Flats & Apartments (17%).
"Ikoyi" has the highest proportion of Maisonettes (60%).
"Ikoyi" has the highest proportion of Mansions (71%).
"Ikoyi" has the highest proportion of Penthouses (39%).
"Lekki" has the highest proportions of Self Contain (21%) with Yaba coming as a close second with 16%.
Visualisation
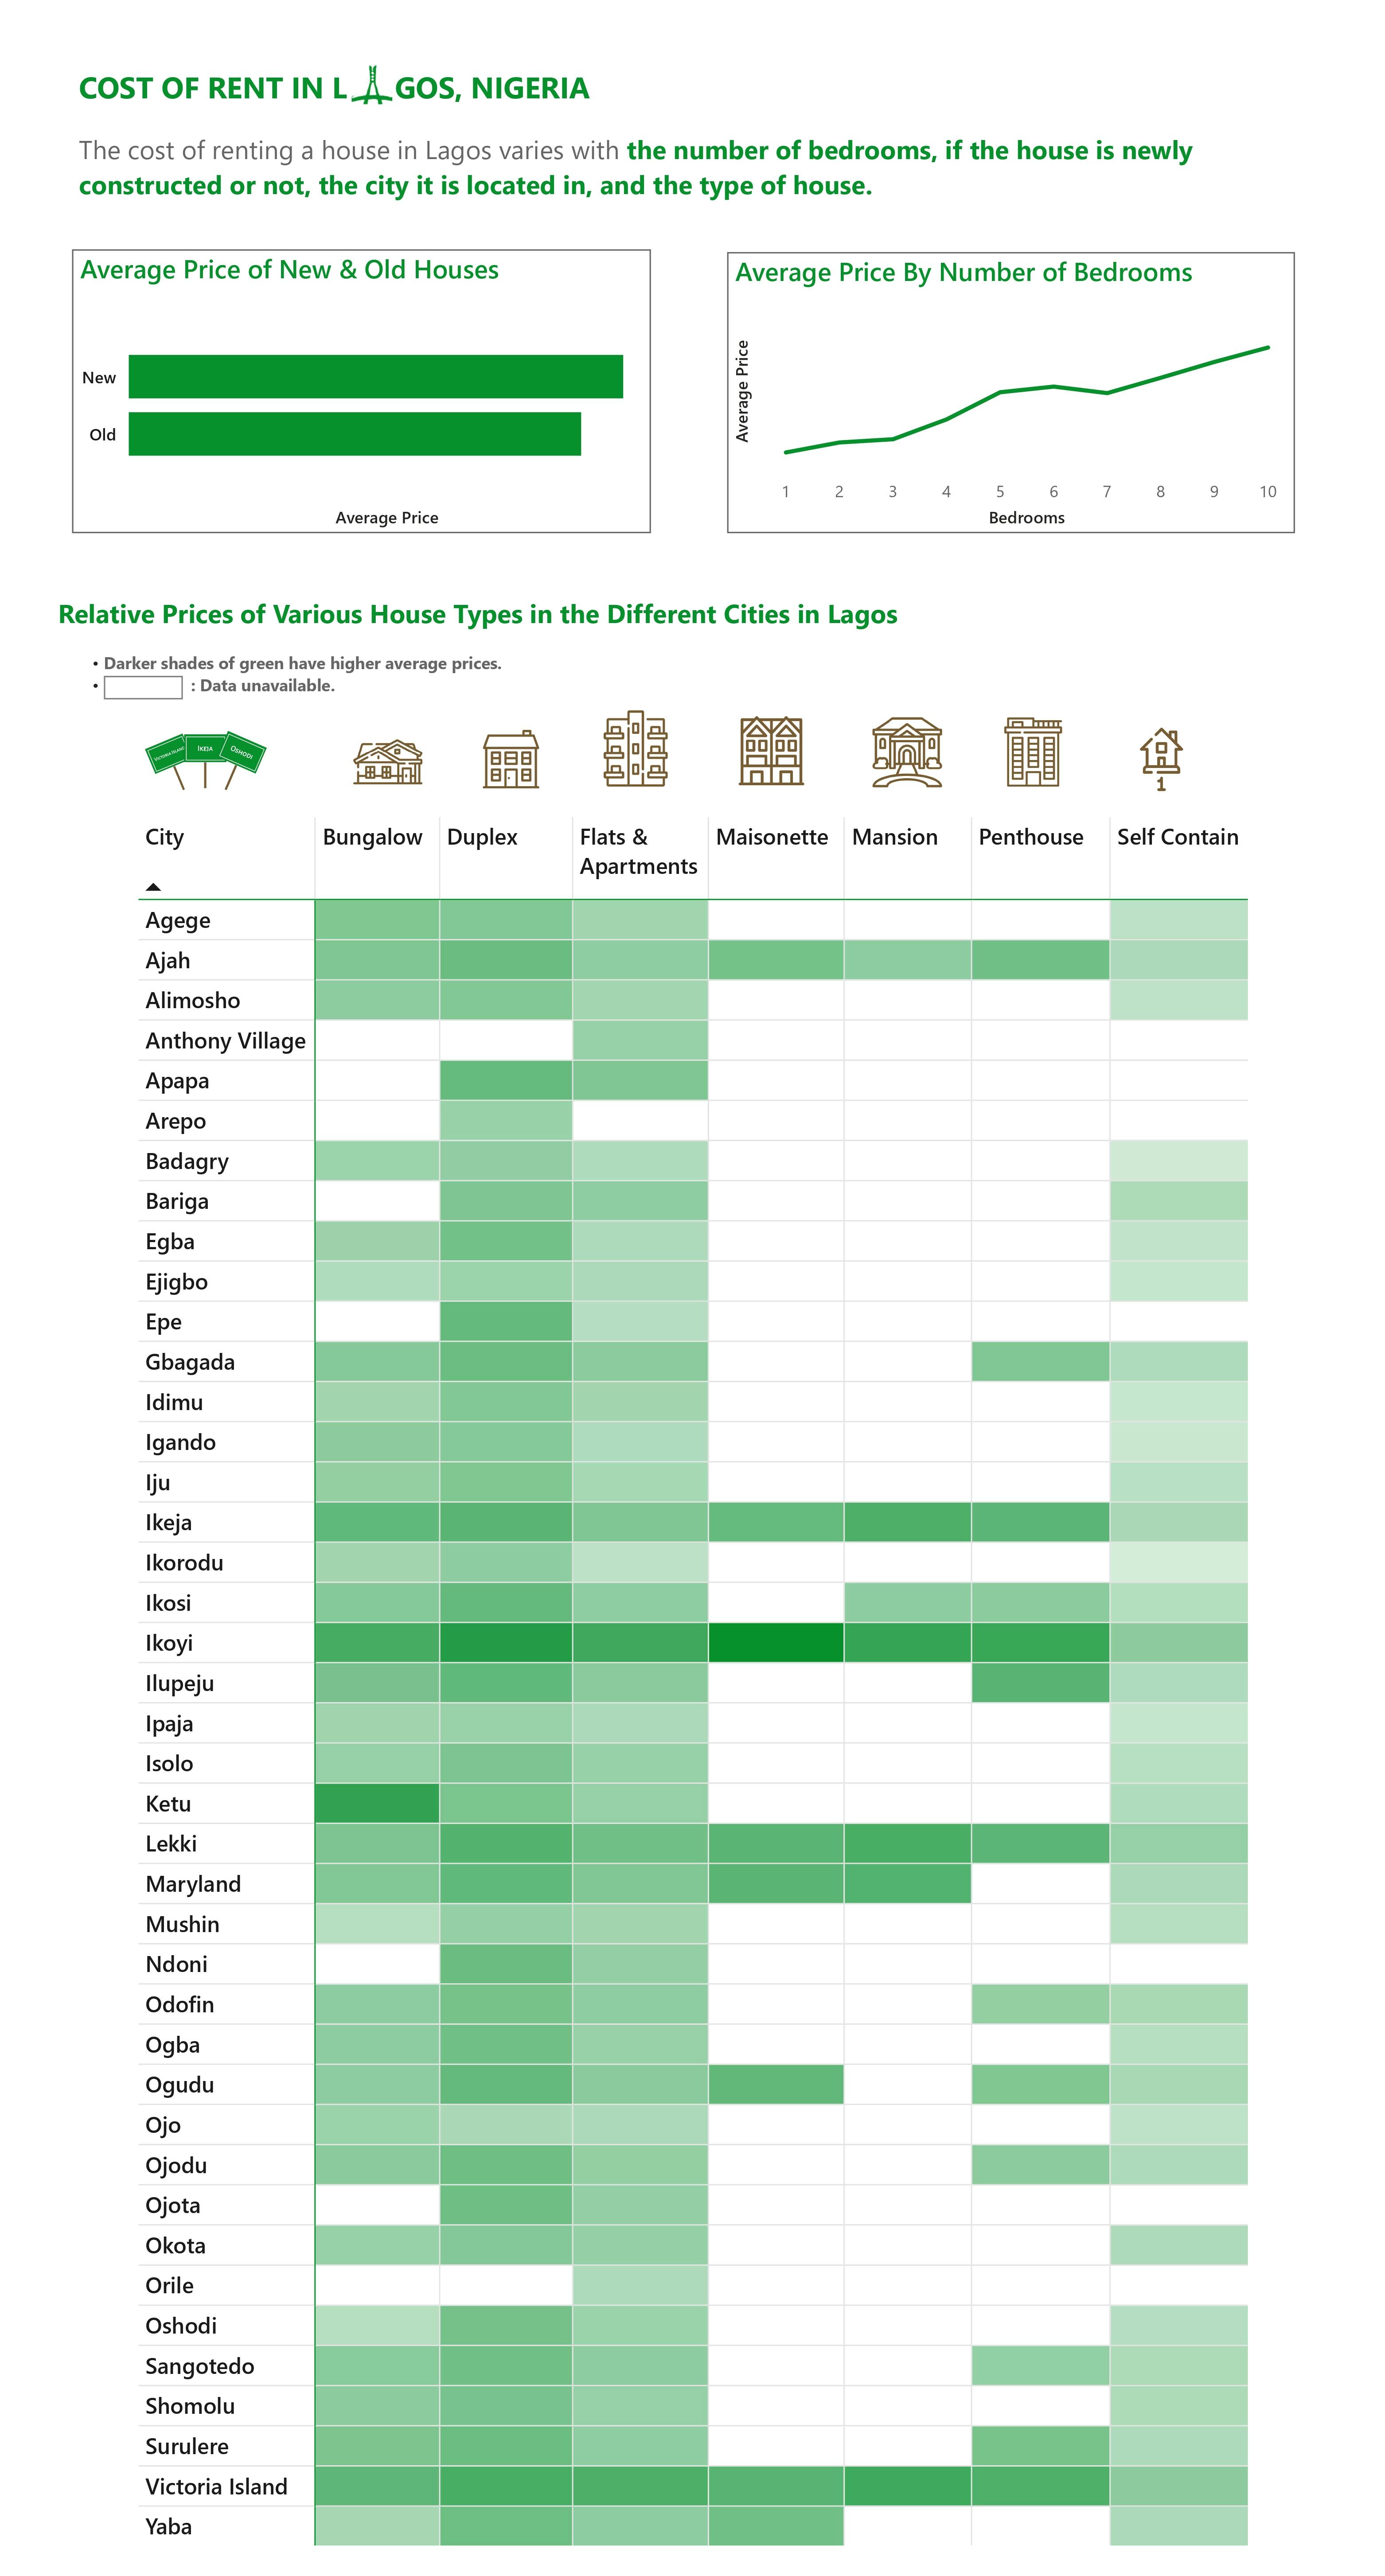
The heatmap comparing the average price of different house types in all cities in Lagos shows that the average price of Duplexes in Lagos is relatively high compared to other house types in contrast to Self Contains which has a relatively low average price in all cities.
Ikoyi and Victoria Island have relatively high average prices for all house types and are the most expensive cities to live in in Lagos.
Conclusion
In conclusion, if you are planning on moving to Lagos anytime soon, hold your money oh! If you are now planning on moving to Ikoyi or Victoria Island, you want a newly constructed or renovated duplex and you now have a large family that will require large living spaces with plenty of bedrooms, just carry that money to your village and build your mansion (lol). Eko Oni Baje ;-).
Click here to access my GitHub repository which contains: the raw scrapped data, the cleaned and processed data and, the R file containing codes used to scrape, clean and, analyse the data.