Analyzing Cyclistic Ride Data
My Google Data Analytics Certificate Capstone Project
I analyse data
Introduction
Cyclistic is a fictional company that launched a successful bike-sharing in 2016. Since then, the program has grown into a fleet of 5,824 bicycles that are geo-tracked and locked into a network of 692 stations across Chicago.
Up until now, Cyclistic's marketing strategy relied on building general awareness and appealing to broad consumer segments. One approach that helped make these things possible was the flexibility of its pricing plans: single-ride passes, full-day passes and annual memberships. Customers who purchase a single ride or full-day passes are referred to as casual riders. Customers who purchase annual memberships are Cyclistic members. Cyclistic's finance analysts have concluded that annual members are much more profitable than casual riders, the director of marketing, Lily Moreno believes that maximizing the number of annual members will be key to future growth. Rather than creating a marketing campaign that targets all-new customers, Moreno believes there is a very good chance to convert casual riders into members. Three questions will guide this new marketing strategy:
- How do annual members and casual riders use Cyclistic bikes differently?
- Why would casual riders buy Cyclistic annual memberships?
- How can Cyclistic use digital media to influence casual riders to become members?
In this scenario, I will be taking on the role of a junior data analyst working in the marketing analyst team in Cyclistic, I have been tasked with finding an answer to the first question;
How do annual members and casual riders use Cyclistic bikes differently?
To do this I will be applying the six phases of data analysis which are: ask, prepare, process, analyze, share and act.
Ask
The ask phase is the start of the data analysis cycle, it involves clearly defining the scope of the project, the problem to be solved, and identifying stakeholders and stakeholders' expectations by asking SMART (Specific, Measurable, Action-oriented, Relevant, Time-bound) questions.
For this project, the problem to be solved is designing marketing strategies that are aimed at converting casual riders into annual members. Insights from my analysis will assist the marketing team in creating a new and efficient marketing strategy to convert casual riders into annual members and also convince the Cyclistic executive team to adopt this new marketing strategy.
The key business task will be to figure out how annual members and casual riders use Cyclistic differently. The results of which I would be presenting to the project's stakeholders: The director of marketing, Lily Moreno and the Cyclistic executive team.
Prepare
This involves identifying the source of the data that will be used for the analysis, ensuring that the data source is reliable, original, comprehensive, current and cited, modelling the data, ensuring that the data is free from any form of bias in the collection of the data and, respecting every aspect of data ethics when handling the data.
The data that will be used for this project is Cyclistic historical data from the previous 12 months which is stored in an online repository (made available by Motivate International Inc. under this license). The data is organized into 12 CSV files, each file containing ride details for every month from May 2021 to May 2022.
The data being first-party ensures that it is reliable and original as it has been collected and stored by Cyclistic itself. Only historical data from the previous 12 months is used to ensure that the data reflects the current trend in Cyclistic rides and a glance at the data shows it contains comprehensive information which provides key metrics to compare rides by annual members and casual riders and will be sufficient to complete the key business task.
Process
This involves all the steps taken to clean the data, making sure the data has integrity(the data is accurate, complete, consistent and trustworthy) before analyzing it, aligning the data to the business objective and also carrying out data verification.
To process the data for this project each CSV file was loaded into individual Excel worksheets. The processing of the data was grouped into 4 major tasks:
- Checking for data integrity: this involved checking for the completeness of the data, ensuring that the datasets contained the correct information and that this information was consistent in all the datasets used.
- Cleaning the dataset: this involved checking for misspellings, inconsistent capitalizations and typos, checking for duplicate entries and blank cells and checking for consistent data format across each column.
- Aligning the dataset with the business task: Aligning the dataset with the business task involves manipulating the data(creating new variables from existing variables) to best answer the business task. To align the dataset, four(4) new variables were created: "ride_length", created by subtracting the time each ride started from the time it ended, "week_day", to show what day in the week each ride started, "start_lat_lng" by combining the start location's latitude and longitude and, "end_lat_lng" by combining the end location's latitude and longitude.
- Verifying the data: this was the last step in processing the data, it involved taking a big picture view of the problem and confirming that the dataset is focused on the business problem.
Analyze
To analyze the data I will be using the following tools: Microsoft Excel, R Studio, and PowerBI to visualize the results of the analysis and Google Slides to create a report of the analysis.
I began my analysis by diving into each dataset, using Excel functions and pivot table to check for trends for each month, noting the average ride length, and maximum ride length, and comparing the frequency and length of rides by casual riders and annual members, their preferred start and stop location, and also their preferred bike type.
N.B: For a detailed report on every month between May 2021 to May 2022 continue reading, for a summary, scroll down to the "summary" section.*
In analyzing the dataset, entries that lasted for more than 24 hours were seen as outliers subject to further analysis as they only constituted a very small portion of the data and were filtered out as they did not represent the general trend for the month and could skew the results of the analysis. Inconsistent data (rides with a start time later than the end time) were also filtered out. This could be assumed to be an entry error with the end time in the start time column and vice versa but with no means to confirm, the entries were filtered out.
May 2021
165 rides out of the 531,632 rides this month lasted for more than 24 hours and were filtered out and the following insights were generated from the analysis.
- The average ride length for this month was for 22 minutes and 47 seconds
- The longest ride lasted for 23 hours and 58 minutes and started at 1:26 on a Saturday by a casual member riding a classic bike.
- Saturdays had the most number of rides with a total of 111, 963 rides.
- Rides by casual riders lasted longer than rides by annual members with casual rides being longer than the average ride length every day and members' rides being shorter.
- Casual riders took more rides only during the weekend(Fridays and Saturdays) than annual members, on the other days of the week annual members take more rides.
- Casual riders and annual members used classic bikes more with 48.27% of total rides by casual riders being with classic bikes and 67.39% of total rides by annual members being with classic bikes.
- Most rides by casual riders started in the location with coordinates - Lat: 41.892278 Lon: -87.612043 and ended in the location with coordinates - Lat: 41.902973 Lon: -87.63128.
- Most rides by Cyclistic members started in the location with coordinates - Lat: 41.902973 Lon: -87.63128 and ended in the location with coordinates - Lat: 41.902973 Lon: -87.63128.
June 2021
232 rides out of 729,591 rides this month lasted for more than 24 hours and were filtered out and the following insights were generated from the analysis.
- The average ride length for this month was for 22 minutes and 54 seconds.
- The longest ride lasted for 21 hours 38 minutes and 52 seconds and started at 1:46 on a Saturday by a casual rider riding a docked bike.
- Saturdays had the most number of rides with a total of 122,252 rides.
- Rides by casual riders lasted longer than rides by annual members with casual rides being longer than the average ride length every day and members' rides being shorter.
- Casual riders took more rides only during the weekend(Fridays and Saturdays) than annual members, on the other days of the week annual members take more rides.
- Casual riders and annual members used classic bikes more with 50.81%of total rides by casual riders being with classic bikes and 59.64% of total rides by annual members being with classic bikes.
- Most rides by casual riders started in the location with coordinates - Lat:41.892278 Lon:-87.612043 and ended in the location with coordinates -Lat: 41.911722 Lon: -87.626804.
- Most rides by Cyclistic members started in the location with coordinates -Lat: 41.902973 Lon: -87.63128 and ended in the location with coordinates - Lat:41.911722 Lon:-87.626804.
July 2021
180 rides out of the 822,296 rides this month lasted for more than 24 hours and were filtered out and the following insights were generated from the analysis.
- The average ride length for this month was for 22 minutes and 4 seconds.
- The longest ride lasted for 21 hours 8 minutes and 33 seconds and started at 0:10 on a Thursday by a casual member riding a docked bike.
- Saturdays had the most number of rides with a total of 162,717 rides.
- Rides by casual riders lasted longer than rides by annual members with casual rides being longer than the average ride length every day and members' rides being shorter.
- Casual riders took more rides only during the weekend(Fridays and Saturdays) than annual members, on the other days of the week annual members take more rides.
- Casual riders and annual members used classic bikes more with 54.64% of total rides by casual riders being with classic bikes and 69.78% of total rides by annual members being with classic bikes.
- Most rides by casual riders started in the location with coordinates - Lat:41.892278 Lat:-87.612043 and ended in the location with coordinates - Lat: 41.911722 Lon: -87.626804,
- Most rides by Cyclistic members started in the location with coordinates - Lat: 41.892278 Lon: -87.612043 and ended in the location with coordinates - Lat:41.892278 Lon: -87.612043.
August 2021
30 inconsistent rides and 88 rides with ride lengths above 24 hours out of the 804,354 rides for this month were filtered out.
- The average ride length for this month was for 21 minutes and 3 seconds.
- The longest ride lasted for 15 hours 1 minute and 5 seconds and started at 2:18 on a Sunday by a casual rider riding a docked bike.
- Sundays had the most number of rides with 142, 728 total rides.
- Rides by casual riders lasted longer than rides by annual members with casual rides being longer than the average ride length every day and members' rides being shorter.
- Casual riders took more rides on Thursdays, Fridays and Saturdays than annual members, on the other days of the week annual members take more rides.
- Casual riders and annual members used classic bikes more with 55.74% of total rides by casual riders being with classic bikes and 69.71% of total rides by annual members being with classic bikes.
- Most rides by casual riders started in the location with coordinates - Lat:41.892278 Lat:-87.612043 and ended in the location with coordinates - Lat: 41.892278 Lon: -87.612043.
- Most rides by Cyclistic members started in the location with coordinates - Lat: 41.911722 Lon: -87.626804 and ended in the location with coordinates - Lat:41.911722 Lon: -87.626804.
September 2021
36 inconsistent rides and 83 rides with ride lengths above 24 hours out of the 756,148 rides for this month were filtered out.
- The average ride length this month was 19 minutes and 49 seconds.
- The longest ride lasted for 17 hours 43 minutes and 53 seconds and started at 0:18 on a Friday by a casual rider riding a docked bike.
- Saturdays had the most number of rides with 124, 123 total rides.
- Rides by casual riders lasted longer than rides by annual members with casual rides being longer than the average ride length every day and members' rides being shorter.
- Casual riders took more rides on weekends(Fridays and Saturdays) than annual members, on the other days of the week annual members take more rides.
- Casual riders and annual members used classic bikes more with 53.72% of total rides by casual riders being with classic bikes and 68.02% of total rides by annual members being with classic bikes.
- Most rides by casual riders started in the location with coordinates - Lat:41.892278 Lat:-87.612043 and ended in the location with coordinates - Lat: 41.892278 Lon: -87.612043.
- Most rides by Cyclistic members started in the location with coordinates - Lat: 41.79 Lon: -87.6 and ended in the location with coordinates - Lat: 41.79 Lon: -87.6.
October 2021
129 rides with ride lengths over 24 hours were filtered out from the 631,228 total rides for this month.
- The average ride length this month was 17 minutes and 20 seconds.
- The longest ride lasted for 16 hours 1 minute and 33 seconds and started at 2:44 on a Sunday by a casual rider riding a docked bike.
- Saturdays had the most number of rides with 128,691 total rides.
- Rides by casual riders lasted longer than rides by annual members with casual rides being longer than the average ride length every day and members' rides being shorter.
- Casual riders took more rides on weekends(Fridays and Saturdays) than annual members, on the other days of the week annual members take more rides.
- Casual riders used electric bikes more with 50.08% of total rides by casual riders being with electric bikes while annual members used classic bikes more with 50.09 % of total rides by annual members being with classic bikes.
- Most rides by casual riders started in the location with coordinates - Lat:41.892278 Lat:-87.612043 and ended in the location with coordinates - Lat: 41.892278 Lon: -87.612043.
- Most rides by Cyclistic members started in the location with coordinates - Lat: 41.79 Lon: -87.6 and ended in the location with coordinates - Lat: 41.79 Lon: -87.6.
November 2021
53 inconsistent rides and 34 rides with ride lengths above 24 hours out of the 359,945 rides for this month were filtered out.
- The average ride length this month was 14.
- The longest ride lasted for 10 hours 10 minutes and 9 seconds and started at 2:19 on a Saturday by a casual rider riding a docked bike.
- Tuesday had the most number of rides with 67,297 total rides.
- Rides by casual riders lasted longer than rides by annual members with casual rides being longer than the average ride length every day and members' rides being shorter.
- Rides by Cyclistic members were more than the rides by casual riders every day of the week this month. Rides by Cyclistic members accounted for 70.31% of the total rides
- Casual riders and Cyclistic members used electric bikes more with 63.10% of total rides by casual riders being with electric bikes and 51.72% of total rides by Cyclistic members being with electric bikes.
- Most rides by casual riders started in the location with coordinates - Lat:41.892278 Lat:-87.612043 and ended in the location with coordinates - Lat: 41.892278 Lon: -87.612043.
- Most rides by Cyclistic members started in the location with coordinates - Lat: 41.79 Lon: -87.6 and ended in the location with coordinates - Lat: 41.79 Lon: -87.6.
December 2021
36 rides with ride lengths over 24 hours were filtered out from the 247,506 total rides for this month.
- The average ride length this month was 13 minutes and 36 seconds.
- The longest ride lasted for 19 hours 19 minutes and 16 seconds and started at 3:14 on a Saturday by a casual rider riding a docked bike.
- Saturdays had the most number of rides with 53,978 total rides.
- Rides by casual riders lasted longer than rides by annual members with casual rides being longer than the average ride length every day and members' rides being shorter.
- Rides by Cyclistic members were more than the rides by casual riders every day of the week this month. Rides by Cyclistic members accounted for 71.84% of the total rides
- Casual riders and Cyclistic members used electric bikes more with 64.56% of total rides by casual riders being with electric bikes and 54.54% of total rides by Cyclistic members being with electric bikes.
- Most rides by casual riders started in the location with coordinates - Lat: 41.880958 Lon: -87.616743 and ended in the location with coordinates - Lat: 41.892278 Lon: -87.612043.
- Most rides by Cyclistic members started in the location with coordinates - Lat: 41.79 Lon: -87.6 and ended in the location with coordinates - Lat: 41.79 Lon: -87.6.
January 2022
104 rides with ride lengths over 24 hours were filtered out from the 103,787 total rides for this month.
- The average ride length this month was 13 minutes and 42 seconds.
- The longest ride lasted for 23 hours and started at 12:25 on a Monday by a Cyclistic member riding a classic bike.
- Thursdays had the most number of rides with 16,545 total rides.
- Rides by casual riders lasted longer than rides by annual members with casual rides being longer than the average ride length every day and members' rides being shorter.
- Rides by Cyclistic members were more than the rides by casual riders every day of the week this month. Rides by Cyclistic members accounted for 82.20% of the total rides.
- Casual riders and Cyclistic members used electric bikes more with 57.36% of total rides by casual riders being with electric bikes and 56.40% of total rides by Cyclistic members being with electric bikes.
- Most rides by casual riders started in the location with coordinates - Lat: Lat: 41.892278 Lon: -87.612043 and ended in the location with coordinates - Lat: 41.902973 Lon: -87.63128.
- Most rides by Cyclistic members started in the location with coordinates - Lat: 41.79 Lon: -87.6 and ended in the location with coordinates - Lat: 41.79 Lon: -87.6.
February 2022
89 rides with ride lengths over 24 hours were filtered out from the 115,611 total rides for this month.
- The average ride length this month was 12 minutes and 36 seconds.
- The longest ride lasted for 23 hours 7 minutes and 33 seconds and started at 12:28 on a Saturday by a casual rider riding a docked bike.
- Monday had the most number of rides with 22,768 total rides.
- Rides by casual riders lasted longer than rides by annual members with casual rides being longer than the average ride length every day and members' rides being shorter.
- Rides by Cyclistic members were more than the rides by casual riders every day of the week this month. Rides by Cyclistic members accounted for 81.52% of the total rides.
- Casual riders used electric bikes more with 55.96% of total rides by casual riders being with electric bikes while Cyclistic members used classic bikes more with 51.38% of total rides by Cyclistic members being with classic bikes.
- Most rides by casual riders started in the location with coordinates - Lat: Lat: 41.892278 Lon: -87.612043 and ended in the location with coordinates - Lat: 41.902973 Lon: -87.63128.
- Most rides by Cyclistic members started in the location with coordinates - Lat: 41.79 Lon: -87.6 and ended in the location with coordinates - Lat: 41.79 Lon: -87.6.
March 2022
2 inconsistent rides and 204 rides with ride lengths above 24 hours out of the 284,042 rides for this month were filtered out.
- The average ride length this month was 15 minutes and 39 seconds.
- The longest ride lasted for 23 hours 55 minutes and 28 seconds and started at 14:24 on a Friday by a Cyclistic member riding a classic bike.
- Wednesdays had the most number of rides with 50,460 total rides.
- Rides by casual riders lasted longer than rides by annual members with casual rides being longer than the average ride length every day and members' rides being shorter.
- Rides by Cyclistic members were more than the rides by casual riders every day of the week this month. Rides by Cyclistic members accounted for 68.41% of the total rides
- Casual riders used electric bikes more with 51.46% of total rides by casual riders being with electric bikes while Cyclistic members used classic bikes more with 51.01% of total rides by Cyclistic members being with classic bikes.
- Most rides by casual riders started in the location with coordinates - Lat: Lat: 41.892278 Lon: -87.612043 and ended in the location with coordinates - Lat: 41.892278 Lon: -87.612043.
- Most rides by Cyclistic members started in the location with coordinates - Lat: 41.79 Lon: -87.6 and ended in the location with coordinates - Lat: 41.79 Lon: -87.6.
April 2022
300 rides with ride lengths over 24 hours were filtered out from the 371,240 total rides for this month.
- The average ride length this month was 12 minutes and 36 seconds.
- The longest ride lasted for 23 hours 58 minutes and 35 seconds and started at 2:37 on a Sunday by a casual rider riding a classic bike.
- Saturday had the most number of rides with 74,300 total rides.
- Rides by casual riders lasted longer than rides by annual members with casual rides being longer than the average ride length every day and members' rides being shorter.
- Rides by Cyclistic members were more than the rides by casual riders every day of the week this month. Rides by Cyclistic members accounted for 60.00% of the total rides.
- Casual riders and Cyclistic members used electric bikes more with 52.92% of total rides by casual riders being with electric bikes and 50.87% of total rides by Cyclistic members being with an electric bike.
- Most rides by casual riders started in the location with coordinates - Lat: Lat: 41.892278 Lon: -87.612043 and ended in the location with coordinates - Lat: 41.892278 Lon: -87.612043.
- Most rides by Cyclistic members started in the location with coordinates - Lat: 41.79 Lon: -87.6 and ended in the location with coordinates - Lat: 41.79 Lon: -87.6.
May 2022
633 rides with ride lengths over 24 hours were filtered out from the 634,829 total rides for this month.
- The average ride length this month was 18 minutes and 33 seconds.
- The longest ride lasted for 23 hours 57 minutes and 42 seconds and started at 17:32 on a Saturday by a casual rider riding a classic bike.
- Monday had the most number of rides with 109,427 total rides.
- Rides by casual riders lasted longer than rides by annual members with casual rides being longer than the average ride length every day and members' rides being shorter.
- Rides by Cyclistic members were more than the rides by casual riders every day of the week this month. Rides by Cyclistic members accounted for 55.88% of the total rides.
- Casual riders used electric bikes more with 45.72% of total rides by casual riders being with electric bikes while Cyclistic members used classic bikes more with 51.03% of total rides by Cyclistic members being with classic bikes.
- Most rides by casual riders started in the location with coordinates - Lat: Lat: 41.892278 Lon: -87.612043 and ended in the location with coordinates - Lat: 41.892278 Lon: -87.612043.
- Most rides by Cyclistic members started in the location with coordinates - Lat: 41.79 Lon: -87.6 and ended in the location with coordinates - Lat: 41.79 Lon: -87.6.
Summary
- Casual riders take longer rides than Cyclistic members with the longest ride every month being by a casual rider the only exception was in January.
- The total number of rides increased from May 2021 to July 2021 and then steadily decreased by 12.1% till January 2022.
- Casual riders preferred to use classic bikes up until October 2021 when more rides by casual were with electric bikes.
- Cyclistic members didn't show a preference for any bike type.
- The station at "Streeter Dr & Grand Ave (Lat: 41.892278 Lon: -87.812043)" is a hotspot for casual riders, most rides by casual riders started and/or ended in this station.
- Casual riders took more rides on Saturdays and Sundays than Cyclistic members every month until November 2021 after which Cyclistic members started taking more rides every day of the week.
From the individual analysis of the data from May 2021 to May 2022, there seem to be seasonal changes in the trend of casual riders' behaviour.
From information on the climate of Chicago gotten from Wikipedia.com, it's seen that the number of rides by Casual riders increases and reduces with the average temperature, with the number of rides peaking in July as the average temperature/month in Chicago is also at its highest and that electric bike use by casual riders increased as temperature reduced.
To confirm this, the dataset was read into R-studio which was used to merge the data into four groups to reflect the four weather seasons in Chicago:
- Spring: March-May
- Summer: June-August
- Fall: September-October
- Winter: November-Feb
Using R to combine the datasets into four groups as stated above, analysis was carried out on each group to ascertain if there is a relationship between the average temperature in Chicago and the behaviour of casual riders and Cyclistic members (i.e if there is a seasonal trend in the behaviour of casual riders and Cyclistic members).
N.B: For a detailed report on each season, continue reading, for a summary, scroll down to the "Summary" section. The visualizations were generated using the ggplot 2 package in R.
Click here to download and view R codes used in analysis.
Spring
- Average ride length of 18 minutes and 30 seconds.
- A total of 1,395,293 rides with 39.63% of the total rides being by casual riders and 60.34% by Cyclistic members.
- Casual riders only took more rides on Saturdays and Sundays.
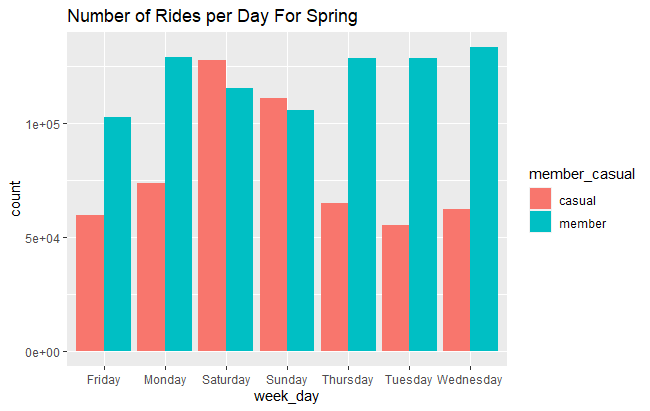
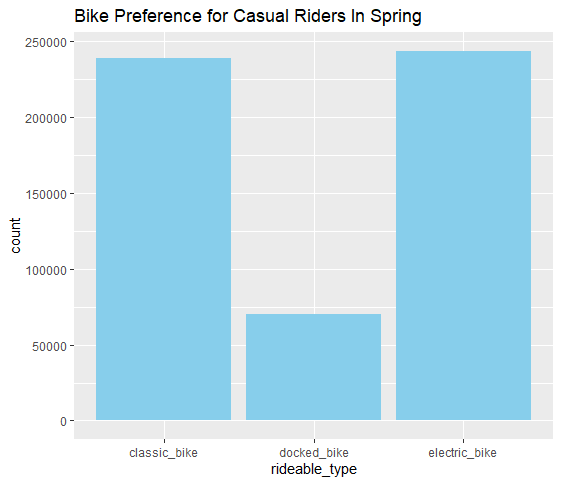
- No distinct bike preference for casual riders.
Summer
- Mean ride length of 21 minutes and 11 seconds.
- A total of 2,355,811 rides with 51.99% of the rides being by casual riders and 48.01% of the rides by Cyclistic members.
- Casual riders only took more rides on Fridays, Saturdays and Sundays.
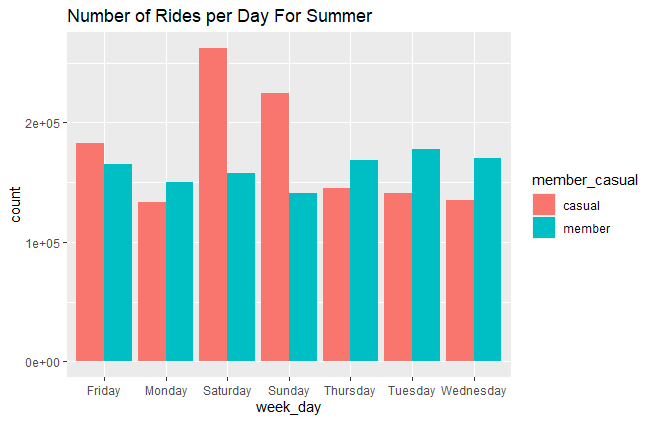
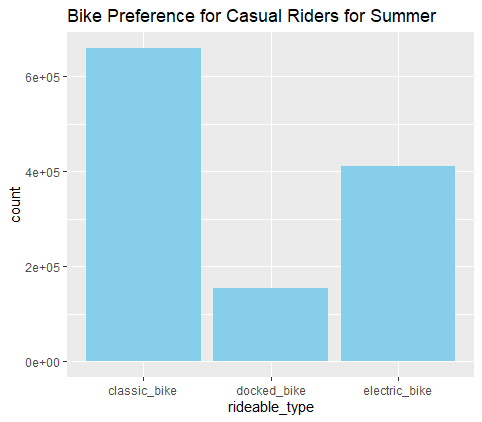
- Casual riders used classic bikes more.
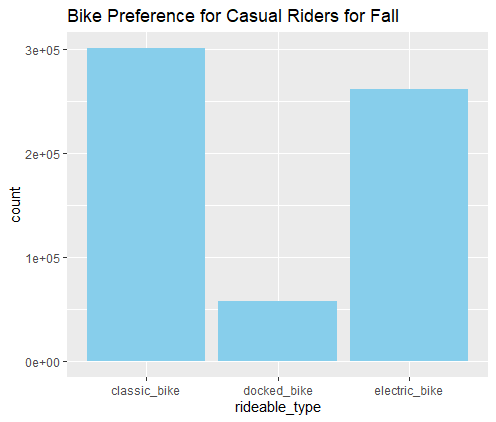
Fall
- Average ride length of 18 minutes.
- A total of 1,387,126 rides with 44.76% of the rides being by casual riders and 55.24% of the rides by Cyclistic members.
- Casual riders only took more rides on Saturdays and Sundays.
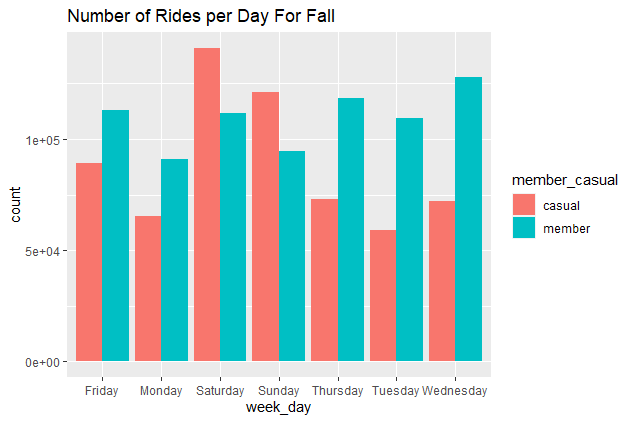
- Casual riders used classic bikes more for their rides.
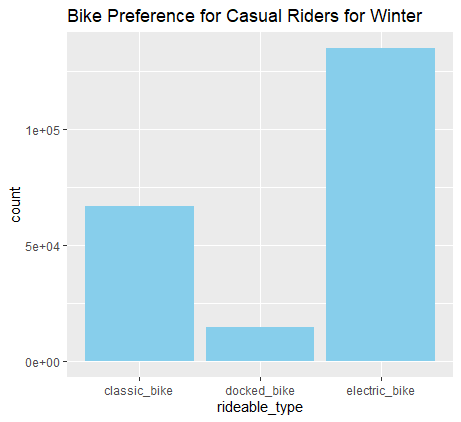
Winter
- Average ride length of 13 minutes and 2 seconds.
- A total of 826,599 rides with 26.18% of the rides being by casual riders and 73.82% by Cyclistic members.
- Members have more rides every day than casual riders.
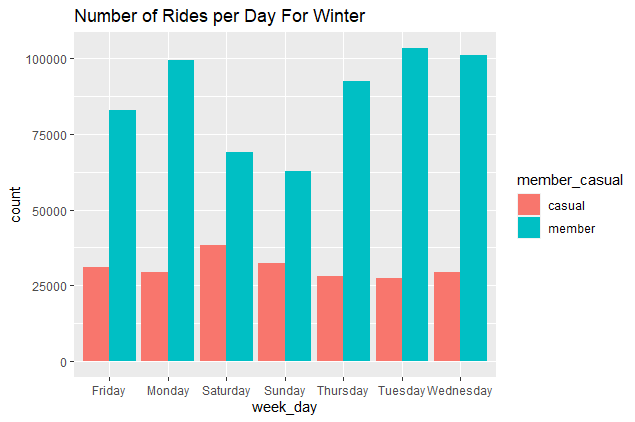
- Casual riders use electric bikes more.
Summary
- The average length of rides taken correlates with the average temperature, with rides being longest in the warmer months of summer and shortest in the cold months of winter.
- The number of rides taken is also at its highest during the warmer months of summer and lowest in the colder months of winter with casual riders taking more rides than Cyclistic members only during summer and casual riders taking the lowest percentage of rides during winter.
- Casual riders take more rides on Saturdays and Sundays compared to any other day except during winter where Cyclistic members take the most rides every day.
- Causal riders show a preference for classic bikes in warmer temperatures of summer and electric bikes in the colder temperature of winter while Cyclistic members do not show any bike preference.
The results of the analysis done with R confirm that there is indeed a seasonal trend in the behaviour of casual riders and Cyclistic members.
The dataset was then combined into a single table and was analyzed for an overview of the rides for the last 12 months and the general behaviour of casual riders and Cyclistic members.
In the previous 12 months, there had been:
- A total of 5,964,829 rides, 43.8% of which were by casual riders and 56.2% by Cyclistic members.
- The average ride length for casual riders was 26 minutes and 6 seconds.
- The average ride length for Cyclistic members was 12 minutes and 54 seconds.
- Casual riders and Cyclistic members used classic bikes more during the period.
Share & Act
These are the final phases of the data analytics process, it involves interpreting and sharing the results of your analysis with the necessary stakeholders, helping them make data-driven decisions and hence prompting action.
For this project, a report of the analysis was created using Google slides containing charts created using PowerBI, it summarizes the results of the analysis, answers the business task and uses insights from the analysis to solve the main problem which is to design marketing strategies to convert casual riders to cyclistic members.
Click here to download and view the report.
